String Finance
Updated: October 14, 2024 at 6:09 PM EDT
Quantifying Financial News
Measuring the impact of the news and public opinion on financial markets is sort of a superpower. This capability, while not new to sophisticated financial institutions is inacessible to many retail investors. Sentiment analysis and similar technologies are particularly valuable for retail investors looking to work in a more empirical approach to event driven strategy.
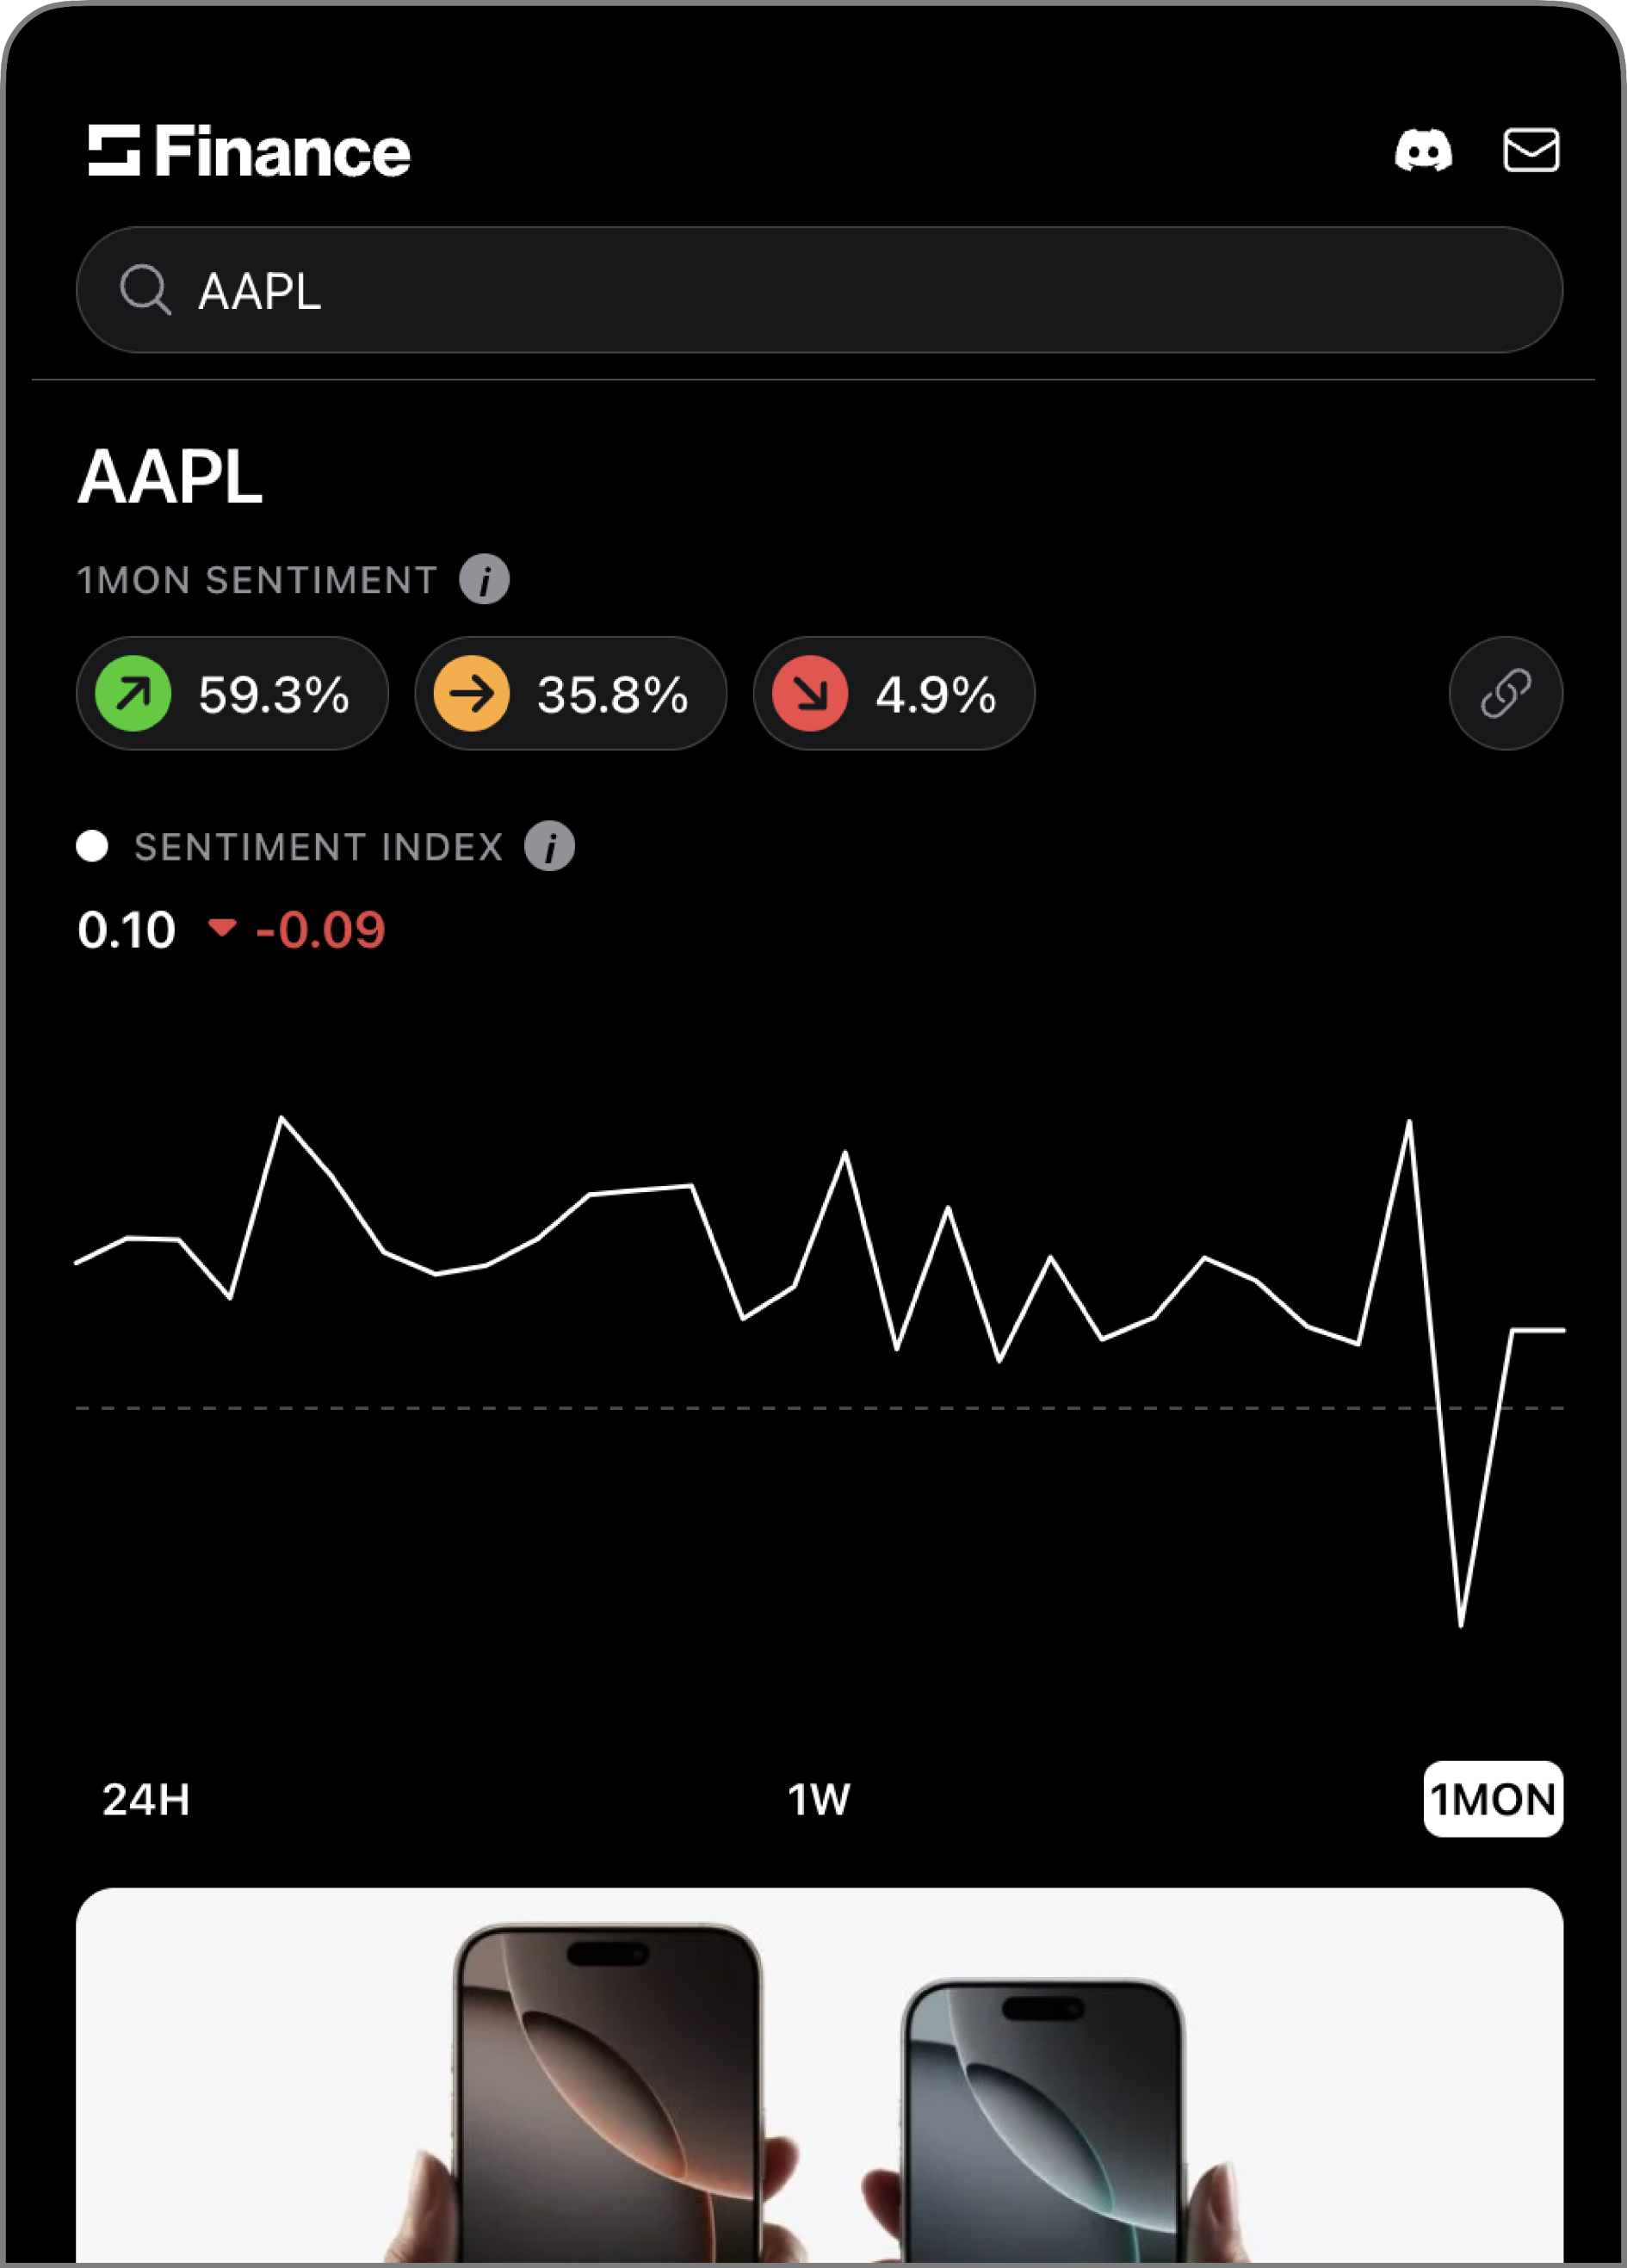
We aimed to create an ultra simple product where users could type in a ticker and easily see the percentage of positive, negative, and neutral news for a stock or security.
News & Links:
UF Students Create App to Help You Manage Investments
String Finance: Official Website
Intuitive design for a non-intuitive problem
Realizing that news is a fuzzy data source and why this is a problem is difficult to arrive at for
many retail investors.
Our initial challenge was defining the product scope and craftting
an experience such that this problem would be obvious and the idea of quantifying news would almost
immediately make sense. When using the product, it should feel like a no-brainer.
Simply displaying polarity
After some time we discovered that the most intuitive format would likely be a positive, negative, neutral category selector. We learned that graphs for sentiment against price actually weren't that intuitive to users as we would have imagined. Also, making these work is quite challenging because scaling the y axis consistently with positive, neutral, and negative sentiments against different stock price is sort of weird.
Ads & Copy
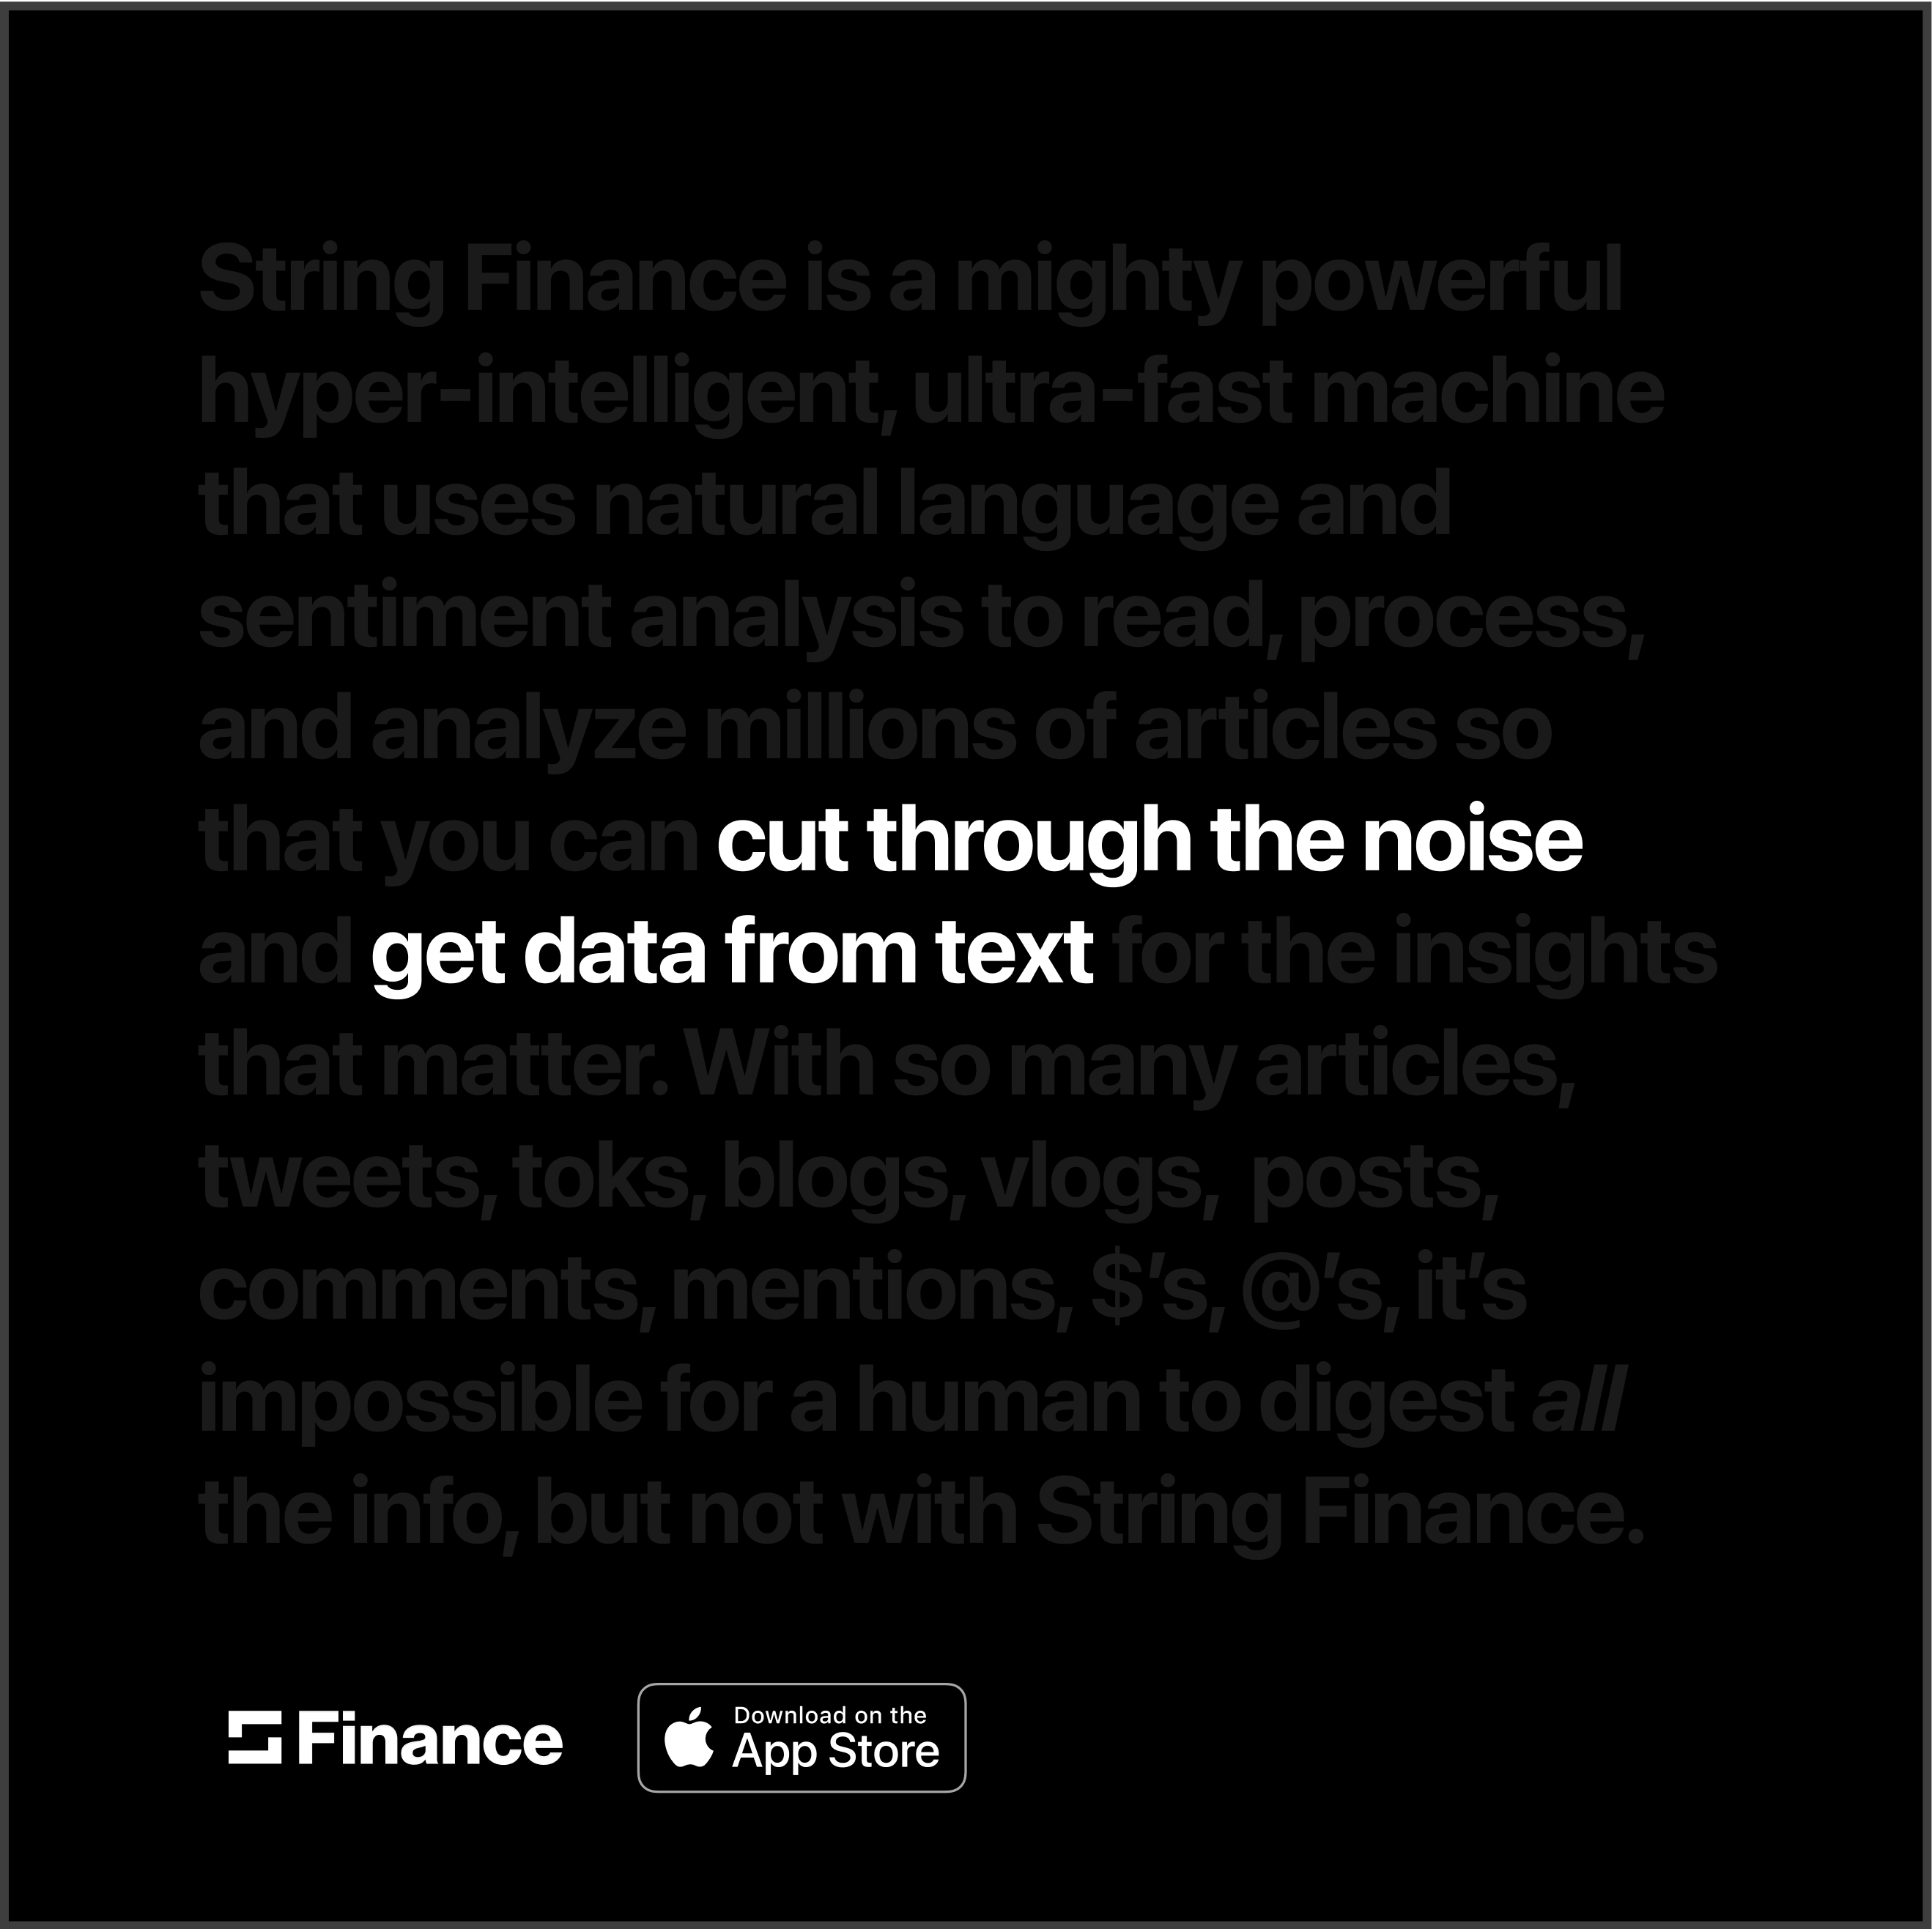
The words in grey function as sort of sumbliminal copy while the words in white are the focus of the ad. The feel of the ad is intended to evoke the idea of "noise cancellation."
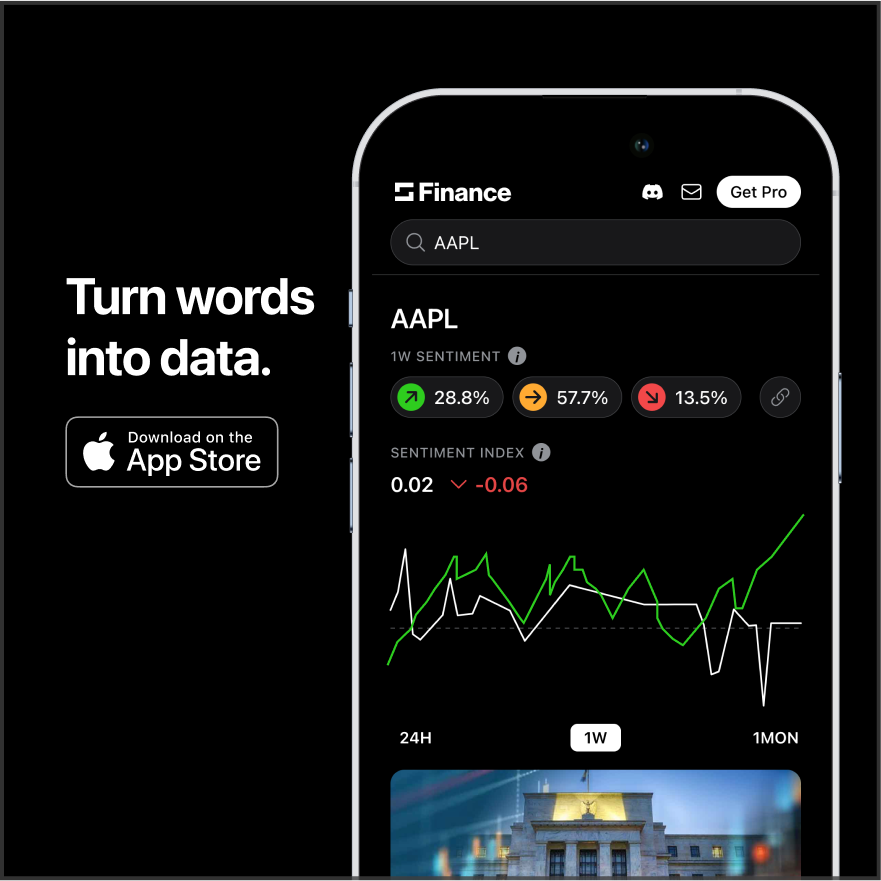
The above is a simple ad that showcases the UI. It's intended to intrigue the user and promise an interesting idea: turning words into data.
Anecdote:
What do negative oil prices have to do
with sentiment analysis?
During the pandemic I had a lot of free time on my hands. I went on a grocery store run and gassed
up my car and noticed how gas prices were abnormally low.
I looked into it more and learned
that because people weren't driving - the oil industry was experiencing an incredible surplus.
Apparently, once you drill for oil - you can't really stop it from coming out of the ground.
After making this observation, I spent about 72 hours pouring over
dozens of articles, blog posts, and offical statements from the IEAA,
OPEC+, and various financial papers trying to determine whether OPEC would be likely to make a price
adjustment and what might happen to prices if lockdowns continue.
Successfully predicting negative spot prices
At the end of the 72 hours and lots of literature later, I came to the conclusion
that OPEC+ would likely not cut production, and the the surplus would become so enormous that
sellers needed to pay buyers to take the oil off their hands.
It turns out this prediction was correct. I placed trades on some ETFs that track WTI spot and made
some cash, but not a lot. I wish that at the time (20yo) I had more knowledge on how to successfully
execute futures contracts along with more capital to work with.
The case for more quantitative event driven strategy
It took me a couple days and many many articles to come to a logical conclusion
on a very fuzzy once in a lifetime scenario. At that point, I was excited to see my prediction come
true but quite mentally exhausted.
It occurred to me how slow mere mortals like ourselves
match up
against sentiment anlaysis or more sophisticated models in coming to the same conclusion.


